

i see screenshots of trends .that need a person to have some instruction to understand what is displayed. i have entered numerical display from oscar for my stats for 1 yr. btw the previous stats from oscar nearly identical. here goes.AHI 1.9 /obstructive index .72/ hypopnoea index .80/ unclassified apnoea index 0.0/clear airway index .39/flow limitation index 1.01/ rera index 2.3. in this display i see immediately any spikes in the treatment. how would these results compare to a person without any apnoea issues? thankyou to anyone who takes time to respond.
A person is not considered to have apnea unless their AHI is greater than 5.0. So, your results are less than the diagnosis threshold for apnea. However, many that are on a CPAP machine achieve less than 1.0 for AHI. I used to average something similar to what your number is with an AHI of 2.1 over a couple of years. I then made an adjustment to my EPR settings and now I am averaging about 0.84 for AHI. My wife averages about 0.62 for AHI. This has come from a fair amount of experimenting and adjustments to see what works and what does not. We are all a bit different. My main issue is CA events, while my wife has more trouble with OA events.
If you can post a screenshot of the Daily tab for a typical day with an AHI of around 1.9 I could comment on where there may be room for improvement.
thanks for your reply.when i get someone to show me how to add screen shot,will do.i purchadse an air sense 10 while waiting for philips replacement and in the time i used it, the central apnoea was .5 now back to using dreamstation. have the flex a setting at 3. ahi 2 and less most of the time 1 ish and on occasions .
To add a Daily report screenshot just make the report full screen in OSCAR, and push the F12 key (on a PC). Note in the bottom right corner the message which will display to show where the screen shot file is saved. Then open a new response here using the orange Write a Reply button on the bottom left to get a full width window. Locate that screenshot file using File Explorer, left click on it, and then drag it into the open message window. It should upload and display. Just upload the one main Daily report screenshot. Uploading multiple screenshots may delay the posting of the message.
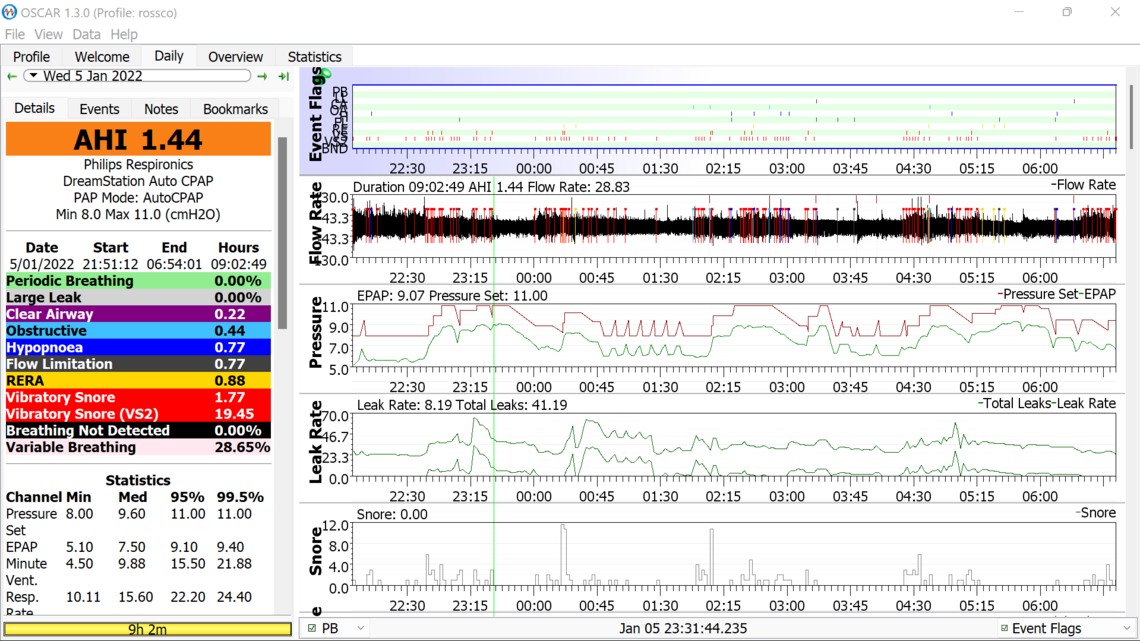
I am finding it hard to read your Event Flags bar. I would suggest a few changes. First, I have never seen much value in flagging the Vibratory Snore, or Vibratory Snore (VS2). About all they do is clutter up the display. At the bottom on the left just under the Snore graph there is a PB and down arrow. If you click on that, I believe you should be able to turn off the VS and VS2 flags and leave the rest on. The other thing you can do is click on the bottom border of the Events Flag bar and drag it down a little to increase the vertical size of the bar to make it easier to read.
From what I can see, the obvious issue is that you are maxing out on pressure quite a bit during the night. It would be worth trying a maximum pressure of 12 cm instead of 11 cm. The DreamStation machines like to drop the pressure aggressively and can benefit from an increase in the minimum pressure to limit how low it can let the pressure drop. I would also suggest an increase in the minimum pressure to 10 cm.
Those are my initial thoughts.
i will make adjustments and see how this affects the results for the next week.thankyou
Some things to watch for on the Daily report page: