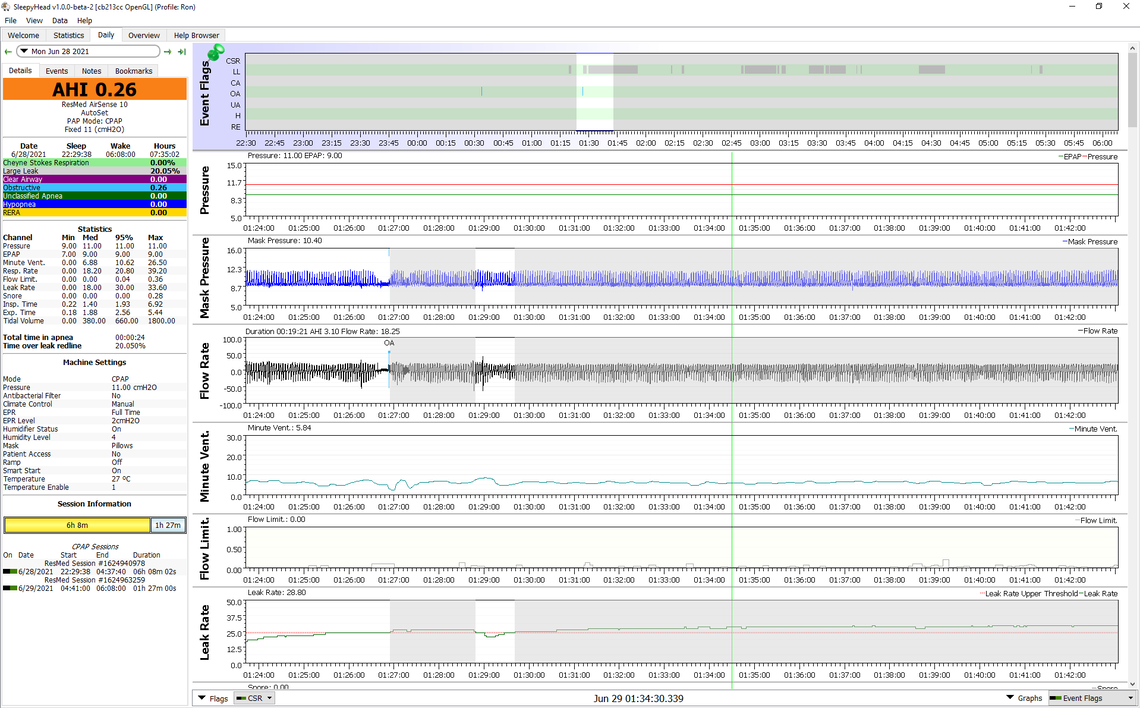
I have been on CPAP for about a year and my AHI's are now down to about 0.50 or less, sometimes 0, mostly with 0 O.A's , only hypoapneas and sometimes unclassified apneas. Lately I feel tired at wake up, though. I notice frequent large leaks, often above 30, sometimes up to 50 or 60 l and I wonder if my fatigue is due to O.A.'s that the machine does not record because of the large leaks. This possibility has already been raised in this Forum as well as elsewhere. In fact, there is a post by Snuzy ( https://myapnea.org/forum/resmed-10/1#comment-18035 ) who did a search confirming that , according to him, ResMed AHI data get compromised when there are large leaks over 30% of the sleep time. I did check my large leaks pattern and I found it is often around 30% of my sleep time. I wonder if this explains my fatigue, even though this claim has been debated. I’d like to see clear on this issue, if possible. Are there any graphs in Oscar pointing to the possibility of hidden OA’s that are not recorded directly in the event flags graph because of the large leaks issue? Also, why doesn’t the machine display red face icons at wake up, when there have been large leaks during the night.? Perhaps it is time I replace the silicon seal on the mask My machine is a Resmed Air Sense 10 Autoset. I use Oscar. The OA's have all but disappeared after my doctor has adjusted the pressure range to 12-16, but can I still have unrecorded OA's because of the leaks?
Thanks
Ittiandro
I am quite sure that ResMed suppresses the reporting of apnea events during the grayed out high leakage segments of the night. I recall they justify this by saying they can't accurately distinguish between the types of apnea, so their "solution" is to not report it at all. However you can still see the flow rate and mask pressure displayed during the grayed out period. If you zoom in on the grayed out sections of the night you can see enough detail to manually identify any apnea events. You probably can't determine the type, but you should easily see if there are any stoppages in flow for 10 seconds or more -- that is an apnea. I went back and found a night where I had some high leakage periods. Right at the beginning before the high leakage started there was a flagged obstructive event. This clearly shows what an apnea event looks like. Flow stops, and if you are using EPR the pressure cycling stops as well. If you look through your high leakage areas you will see if you are having any events that look like this. I looked through mine, and found none. Here is the screenshot with the scale expanded to see the apnea event detail. Hope that helps some,

Thanks Sierra
A. The whole point is to determine whether or not LL areas hide apneas. From my own records, some LL ( 20% of the total sleep time and above) do show apneas, some don’t, so we are back to square one: how can we know whether or not there are hidden apneas corresponding to the grayed out LL areas?
B. There are LL zones in the event flag graph which do not show apneas under them, yet the Flow Limit graph in Oscar ( I assume that it is the same as the Flow Rate in Sleepy Head) does show a flat bar at value 0 at the same time area of the LL. ( Are these flat bar segments, with 0 value, in the Flow Rate ( or Flow limit) breathing interruptions? If so, why then are they not recorded as apneas? May be because too short? Actually the Flow Limit graph shows a few such flat zones at 0 not matched by a corresponding LL and/or an apnea in the event flag graph. Can these be unrecorded apneas ? If you tell me how to attach the Oscar daily report for June 5, I’ll send it. You told me once, but I forgot.
C.Incidentally, what is the difference between the Pressure graph and the Mask pressure one?
Thanks
Ittiandro
A. The apnea periods are obvious from the flow graph. Zero flow for 10+ seconds is an apnea. If you expand the scale out you should be able to see if the zero flow lasts 10 seconds or not. B. Flow Limitations are not the same as the flow rate graph. This is just an indication where Resmed thinks the flow is being limited but not stopped. To export a graph just press F12 and take note in the bottom right of the screen where the screenshot is saved. Use File Explorer to find the saved screenshot, and left click on it, and drag it into a message here. C. The Pressure graph is the set inhale pressure that the machine wants to use. The Mask Pressure is the actual pressure at the mask estimated by the machine. It moves up and down with each breath if you have EPR turned on.