Hello, my name is Andrey I am CPAP newbie just trying to make it working for me. I still did not master it to a degree to have a full night sleep, not even close. Few hours a night at best. My apnea is on light side but I sleep very poorly with or without the machine. Hope you guys support me with some advice.
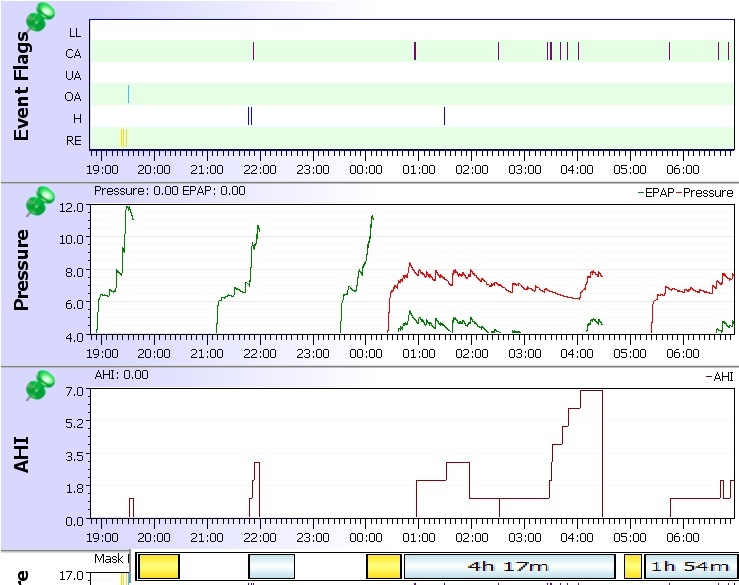
For now a question: events detected by CPAP machine and displayed on Sleepyhead graphs. Are events that machine repaired or events that happened even though machine was working?
Here is last night's plots. Some plots. I am not yet sure which plots contain meaningful information. You also can see early in the plot I was mostly observing machine's operation, certainly not sleeping.

Not sure if any meaningful comments can be concluded.
What I am seeing is that almost all of your event are central apnea events. What Kind of machine do you have? It appears you have EPR or Flex turned on at 3? The basic issue is that pressure cannot prevent central apnea events, and may even make them worse. The first thing I would do is ask your provider about reducing turning off the EPR or Flex and about reducing the maximum pressure.
You have found a good place to have someone help with this. Unfortunately, that isn't me. But there is good support and information on here and great people to share their experiences. For most people it takes awhile to get comfortable with the machine and mask or pillow. Even after many years, I have nights when it just bugs the heck out of me. It is surely a love/hate relationship for me.
The most useful charts for diagnostic purposes are:
Event Flags Flow Rate Pressure Leak Rate Snore Flow Limit (Resmed Only. Respironics includes Flow Limitation in Events) If additional charts are needed they will be asked for.
Each chart has a name displayed on it vertically on the left side of the chart.
You can move a chart up or down in the order by pointing your mouse pointer in the label part of the chart, left clicking and dragging up or down to change the order.
The chart height can be resized by pointing your mouse at the border of a graph until the cursor changes to a double bar with an arrow above and below, then dragging the border up or down
Also include the left sidebar without the PieChart, or the Calendar. That includes important statistical info and your settings